Network
See the structure of medication use
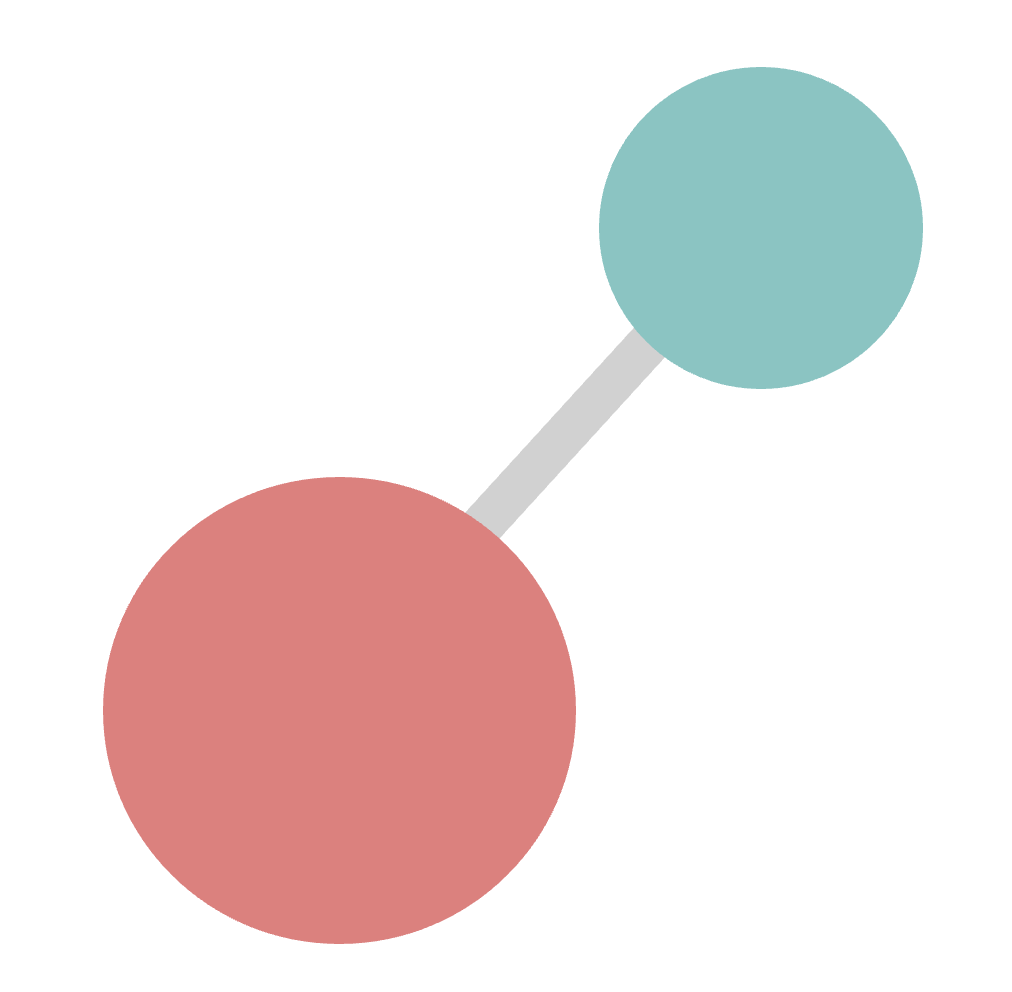
Nodes show medication prevalence; links show co-medication. Use this view to identify dominant medications, highly connected drug classes, and changes around diagnosis.
MINT-D uses UK primary care data to visualise medication prevalence and co-medication patterns for 59 chronic medication classes and 69 CNS drug substances in people living with dementia from 10 years prior to 5 years post dementia diagnosis, stratified by sex and age group.
Nodes show medication prevalence; links show co-medication. Use this view to identify dominant medications, highly connected drug classes, and changes around diagnosis.
The matrix provides co-medication prevalence across years, age groups, and sex. Use this to identify which drug combinations are most common and potential targets for deprescribing.
Heatmaps highlight how prevalence varies before and after dementia diagnosis.
MINT-D was built by Olivia Hopkinson, a PhD student at University College London (UCL) School of Pharmacy, supervised by Dr Wallis Lau and Professor Li Wei.